Video Viewing Patterns Using Different Teaching Treatments: A Case Study Using YouTube Analytics

Abstract
This study explores the viewing patterns of 17 instructional videos in both a traditional and flipped classroom environment by 732 business students taking an IT-related module. While previous work has concentrated mainly on outputs (e.g. student satisfaction/results), this study focuses on how the nature of students’ interactions with videos can be determined through a deep analysis of analytics data. The main findings show that there were less interactions with the instructional videos in the flipped classroom environment compared to the traditional environment, and that videos were used more as a revision aid prior to exams (in both environments) than as an ongoing support to develop skills during term. Implications of this study include the need for regular monitoring of how instructional videos are being used during term and the importance of undertaking a deeper analysis of analytics data as the initial summary data may be misleading.
Keywords
Learning Analytics, You Tube videos, Video-Based Instruction, Viewing Patterns, Flipped-Classroom
Resumen
Este estudio explora los patrones de visualización de 17 videos instruccionales en un contexto tradicional de aprendizaje y en un contexto de clase invertida por 723 estudiantes de negocios cursando un módulo relacionado con IT. Mientras investigaciones anteriores se centraban en resultados (por ejemplo, satisfacción/resultados de los alumnos), en este estudio el foco recae en cómo la naturaleza de las interacciones de los estudiantes con los videos puede determinarse a través de un análisis profundo de los datos analíticos. Nuestros resultados muestran menor interacción con los videos instruccionales en el contexto de clase invertida que en el de clase tradicional. Asimismo, muestran un mayor uso de los videos como material de revisión antes del examen en ambos contextos de aprendizaje que un uso como soporte pedagógico para el desarrollo de habilidades a lo largo del semestre. Las implicaciones de este estudio apuntan hacia la necesidad de una monitorización habitual del uso de los videos instruccionales durante el semestre. Del mismo modo, se constata la importancia de llevar a cabo un análisis más profundo de los datos analísticos puesto que el sumario de datos iniciales en muchos casos puede ser engañoso.
Palabras clave
analíticas de aprendizaje, video de You Tube, instrucción basada en videos, patrones de visionado, clase invertida
Resum
Aquest estudi explora els patrons de visualització de 17 vídeos instruccionals en un context tradicional d´aprenentatge i en un context de classe invertida per 723 estudiants de negocis cursant un mòdul relacionat amb IT. Mentre recerques anteriors s’han centrat principalment en resultats (per exemple, satisfacció/resultats dels alumnes), en aquest estudi l’enfocament recau en com la natura de les interaccions del estudiants amb el vídeos por determinar-se mitjançant un anàlisi profund de les dades analítiques. Els nostres resultats mostren menys interacció amb els vídeos instruccionals en el context de la classe invertida que en el de la classe tradicional. De la mateixa manera, mostren un ús més elevat dels vídeos com a material de revisió abans de l’examen durant el semestre en ambdós contexts d’aprenentatge que no pas un ús com a suport pedagògic pel desenvolupament d’habilitats durant el semestre. Les implicacions d’aquest estudi suggereixen la necessitat de monitoritzar de forma regular l’ús de vídeos instruccionals durant el semestre, així com la importància de realitzar un anàlisi més profund de les dades analítiques ja que el sumari de dades inicial en molts casos pot resultar enganyós.
Paraules clau
analítiques d'aprenentatge, video de You Tube, instrucció basada en vídeos, patrons de visualització, classe invertida
Practitioner notes
What is already known about the topic
-
Educational videos are becoming increasing used as learning objects, embedded in VLE courses and increase students’ perceptions of efficacy. They (educational videos) provide the ability to flip classroom activities so that content is transmitted prior to class allowing more time for interactions within the classroom. Existing research on flipped classrooms has typically focused on outputs and perceptions of the process, yielding mixed results; rather than on the process itself.
What this paper adds
-
Rather than examine student perceptions of the flipped classroom process, this paper examined YouTubeAnalytics data in order to better understand differences in students' engagement with videos in flipped and non-flipped contexts. Students accessed videos more in the non-flipped context where videos were supported by a traditional lecture. In both flipped and non-flipped contexts the videos were used more as a revision aid later in the course than for initial learning. More difficult material was viewed most during the initial learning period and was watched for longer.
Implications of this research and/ or practice
-
While the flipped classroom is seen as a way of moving content delivery away from the classroom, there is value in traditional lectures to support and contextualise online material. There is a need to go beyond the number of times videos are viewed to examine when and for how long such material is accessed, and the relative degree of difficulty involved, to gain a better understanding of how students use such online resources.
Introduction
In recent years, there has been a growing interest and awareness of learning analytics and educational data mining in the higher education sector (S., A., & S.B., 2018). Tools such as YouTube analytics enable instructors to identify the usage patterns of their instructional videos, thereby gaining insight into their effectiveness. (C. & D., 2018) suggest learning analytics data can also be of significant use to students by reporting on their individual progress. Consequently, traditional on-campus institutions are availing of technological advances to offer a richer student experience. One such advance, which has gained momentum in recent times, is video-based instruction. It is used extensively in a flipped classroom environment whereby course materials are provided to students in advance of the face-to-face (f2f) session allowing traditional home activities to be undertaken during class time, under the direction of the teacher (A.P. & F., 2018; Commission,, 2014; S., L.Y.A., & W.S., 2018; Y. & M., 2017).
The literature on learning analytics in higher education predominantly focuses on a single teaching treatment (e.g. in a flipped classroom or traditional classroom environment). Studies carried out to date are somewhat limited in their usage of data analytics, particularly with regards to exploiting data available from sources such as Google/YouTube. This paper attempts to bridge this gap and is novel in that it explores how teachers can use freely available data extracted from YouTube Analytics to evaluate students’ video viewing patterns. Furthermore, this paper examines how such data can be used to compare two different teaching treatments, with a view to gaining additional insight into students’ viewing patterns in different learning environments.
Background Context
This section presents a brief overview of some research on the use of video instruction in higher education. It then explores student satisfaction and performance in the ‘flipped’ classroom and concludes with a short discussion on the role of analytics in identifying usage patterns relating to online videos.
Use of Video in Higher Education
In recent years, media, and video in particular, has dramatically changed the educational landscape. The effective use of video can transform the way we teach, learn, study, communicate, and work. The use of video as a learning medium has a long tradition in education, but its availability has radically changed during the last years (J., 2018). Today, documentaries, film scenes, and explanatory videos can be found on online platforms like YouTube, Vimeo and many others. Also the style of the videos has been dramatically modified, because of new technological possibilities that allow you to record your screen and voice while working with software or to use 3D figures and avatars to tell a story. YouTube is one of the most popular websites on the internet, with over 100 hours of video being uploaded every minute (J., S., & A., 2018). One billion hours of video are watched on YouTube every day and more than half of YouTube views come from mobile devices (YouTube, 2019). Educational videos have evolved to become an integral part of higher education, providing an important content-delivery tool in many flipped, blended, and online classes. Effective use of video as an educational tool is enhanced when instructors consider three elements: how to manage cognitive load of the video; how to maximise student engagement with the video; and how to promote active learning from the video (Brame, 2016).
Thanks to Virtual Learning Environments (VLEs), disseminating videos or URL links to videos has become much simpler. Links to YouTube videos can be embedded into course material, discussion forums, and targeted learning objects. However, according to (J., 2018), the production of quality video content still remains a significant expense. (Y. & S., 2018) claim that although there is a significant expense associated with the preparation of high production multicamera videos, when the contents are reused, the expense is well justified. Anything that can make the production of video less expensive will enable its increased and more effective growth in higher education environments (J. & M., 2018; J., 2018).
Buzzetto-More’s (2015) research into student attitudes towards the integration of YouTube in higher education found that incorporating targeted YouTube videos significantly enhances students’ perception of learning efficacy and increases engagement, so much so that its continued usage should be fostered. (J., 2013) identified a number of patterns about how students view video material. Some students watch the complete video in one non-stop ‘sitting’ while others watch multiple times; some students repeatedly select specific sections (perhaps due to more challenging content), whereas others move quickly through the video jumping from one section to another. In many cases there remains a discrepancy between the way that students report how they view videos, and what the data collected from servers indicates (I., 2015). It must be noted, however, that it is not straightforward to track the learning process of students. Just because a video is streaming to a student’s computer, it does not mean that the video is being watched, or what, if any, kind of learning is taking place.
The Flipped Classroom
Flipped classroom approach has become a popular pedagogy in many education institutes around the world. The basic notion of flipped classroom approach is to deliver the instructor’s lectures before class through online videos, in order to free-up the in-class time for active learning and problem-solving activities (C.K. & K.F., 2017). The use of the flipped classroom approach has been extensively studied, especially in the context of higher education (C.R., 2016; J., 2016; J.S., 2015; V., H., R., & M., 2016; W.J., 2016; Z. & S.H., 2016). The roles and responsibilities of instructor and student are proactive and often require a new or enhanced skill set (R. & S., 2018). The instructor designs intentional learning experiences to engage students. The learner is accountable for exploring materials such as modules, videos, or readings, in a self‐directed manner. The flipped classroom approach to teaching has become attractive to educators due to many reasons, including the ever increasing accessibility of online resources, particularly video based resources; the capacity to generate original video-based learning resources; the ability to provide a more personalised learning experience for the students; and the conviction these factors can allow students to produce stronger academic work (J., 2016).
The concept of a flipped classroom is in stark contrast to the notion of requiring students to attend so that material can be disseminated. In a flipped environment, teachers typically record short screencast videos of their lectures or record podcasts and then upload them to a virtual learning environment (VLE). In some cases, massive open online course (MOOC) materials have been used to support flipped classroom environments (D. et al., 2014). Students view these materials before class with a view to being better prepared to engage in activities during class. Ideally, a flipped classroom session should focus on collaboration and interactive problem-solving activities, with the teacher providing more of a supporting role.
Much of the literature carried out to date has focused more on outputs (such as student performance) as well as perceptions (such as students’ satisfaction with a flipped classroom approach) and studies have reported mixed results. For example, (G.C. & H.G., 2015) examined student performance in a chemistry course, to determine if flipping increased student scores and pass rates, when compared to the traditional f2f lecture approach. They found that student scores were ‘significantly higher’ and the majority of students found the flipped classroom to be of benefit (p. 1437). In another study, (T.M. & M.S., 2017) examined the viewing patters of students regarding recorded lectures on a course that had been flipped. Their findings revealed a decline in the number of students who view the recordings over the duration of the course semester. In addition, they demonstrated that there was a positive correlation between viewing the recorded material and the final grade of students on the course. They thus surmised that even if in-class activities are very important for the flipped classroom to work, the recordings do have additional value, which was reflected by higher final course grades for students who viewed them. The flexibility of viewing recordings more than once and at the most relevant and convenient time seem to increase students’ understanding, and is regarded an important asset of flipped classroom teaching. (P., J., M., M., & D., 2017) conducted a quantitative study on flipped classroom effects and found slightly higher achievement in the flipped classroom experience compared to conventional classes but stressed that the design of the flipped experience was paramount. In particular, they noted that in-class activities should focus on active learning and that the level of pre-class preparation from students was very important - echoing a concern raised by (T., J., & M., 2017).
However, some scholars have found more mixed results. For example, (J.F., 2012) reported that students taking an introductory statistics course were less satisfied in a flipped environment in terms of how prepared they were for classroom-based tasks; however, they ‘became more open to cooperative learning and innovative teaching methods’ (p. 172). (J.F., 2012) suggests that introductory students might not yet be prepared for this kind of independent learning, and they may need more time to ‘make necessary connections to course content’ (p. 192). He also suggested that teachers may need to provide more, or different, types of support to students in an inverted classroom, and they might want to consider different types of flipped learning, perhaps by incorporating some traditional teaching as well as collaborative activities. (S.A., M.V., N., C., & K., 2015) found no significant differences in the learning outcomes for nursing students randomly assigned to either a flipped or traditional teaching style; (V. et al., 2016) found overall themes of neutral or positive academic outcomes and mixed results for satisfaction with the flipped classroom approach. These mixed results can lead to conclusions that flipped classroom can be an effective strategy but that the real difference may be in how flipped classrooms are implemented (J.L., E.A., J.B., T., & R., 2018).
Video and Learning Analytics
With the rise in online and blended learning, massive open and online courses and flipped classroom approaches, the use of video has seen a steady increase (N. & L., 2017). Furthermore, with recent advances in video streaming technologies, learners’ digital footprints when accessing videos can be mined and analysed to better understand how they learn and engage with them. Although much research has been done, particularly focusing on psychological aspects, the educational value, and the user experience, the advancements of the technology and the emergence of analytics provide an opportunity to explore and integrate not only how videos are used in the curriculum but whether their adoption has contributed towards learner engagement or learning (M.N., K., & N., 2014).
Several studies have explored when and how students use online instructional videos. (G., 2015) used Google Analytics to examine usage patterns of video tutorials created to supplement introductory physics lectures for engineering students. Interestingly, they found that although not compulsory, most students used the video tutorials and showed a high level of engagement with the materials. While students viewed video tutorials throughout the term, a significant number of students also used them as a revision aid for exams later in the term. (A.M., 2013) investigated the impact of (short) assigned online videos on student learning in an introductory biology programme. By tracking access, the data showed that in a ‘flipped’ classroom environment, video watching was consistently above 80%, suggesting that videos work well in supporting learning outside of the classroom, freeing-up precious class time. They also found that if the ‘viewing burden’ is heavy and students are not incentivised, videos tend not be as well received.
(M., R., & G., 2013) measured attendance and online lecture video accesses to determine if students use online recordings of live lectures to catch-up after missing a class and also, more importantly, within what timeframe. They found students tended to use the videos variably, but when an exam is forthcoming, access patterns, particularly amongst absentees, showed a significant increase. This finding is consistent with earlier findings by (J.A. & G.D., 2004) who found a peak in access occurs around exam time. In a more recent study, (Y. et al., 2018) used data generated from YouTube analytics to determine the viewing patterns and usage of 76 short-topic videos by first year students on an introductory course in engineering. Videos were prepared with an average length of 8:11 minutes, each covering a specific and discrete topic from the course. Based on the YouTube analytical data, they were able to identify, for example, the number of views, the average view durations and identify the different sections of the videos that were watched multiple times.
Analysing video-watching patterns provides a unique opportunity to appreciate how, and if, students learn more effectively via video. (J. et al., 2014) carried out a large-scale analysis of in-video drop-outs and peaks in viewership and student activity using data mined from 862 videos across four different MOOCs. They found that when videos were too long, students tended to abandon them. Points of interest and/or possible points of confusion were indicated by re-watching common sections of video (peaks). (J. et al., 2014) examined these peaks further and attempted to identify explanatory student activity patterns.
Despite the growing literature on the benefits of video-based instruction and the flipped classroom approach, there is limited research on how instructors can use YouTubeAnalytics data to inform their teaching approaches. With that in mind, this study attempts to answer the following questions:
-
Do students view videos more when used in a flipped classroom, or when they are a supplementary resource to a traditional lecture?
-
To what extent do students use videos as a tool for (a) initial learning (b) revision?
-
Does the difficulty of the material affect video viewing patterns?
-
How much [what proportion] of the videos are watched?
-
Does the difficulty of the material affect how much [what proportion] of the videos are watched?
-
To what extent do students watch a series of videos on a topic?
Methodology
This section describes in detail the two teaching treatments that were used, in successive years, for a module. It also describes the characteristics of the instructional videos, the data collected, and the rationale for the data analysis methods employed. Expanding on studies carried out to date and leveraging the growing body of data that can be captured via analytics, this study seeks to investigate and probe a milieu of behaviours and usage patterns – for example, exploring the significance of the difficulty of the video content.
Module Description and Teaching Treatments
A series of instructional videos were developed specifically for a module entitled ‘Business Information Management’ that covered both Information Systems theory and practical spreadsheet skills using Microsoft Excel. It was a mandatory module for first-year undergraduate students taking a Bachelor of Business Studies degree. The module assumed no prior knowledge of the material though some students had previously used spreadsheets. Students attended two one-hour lectures per week and five one-hour computer labs over the semester. In addition to an end-of-term theory exam, there was also a one-hour end-of-term practical spreadsheet exam.
Before each lab session, students were provided with the following resources:
-
links to the relevant YouTube videos
-
a spreadsheet containing data required for the weekly topic
-
a worksheet with questions that required students to apply concepts covered by the video material, by modifying the spreadsheet data
Additional support was provided in the five weekly computer labs during which students could work on their worksheet, ask questions of the teaching assistant, and receive individual feedback. Teaching assistants did not provide an outline of the concepts required, as students were expected to have engaged with this material prior to the lab. Students were not permitted to watch the videos during the labs. At the end of each week, an ‘answer’ spreadsheet was posted online. No marks for attendance were allocated and the practical component was assessed using only an end-of-term practical exam.
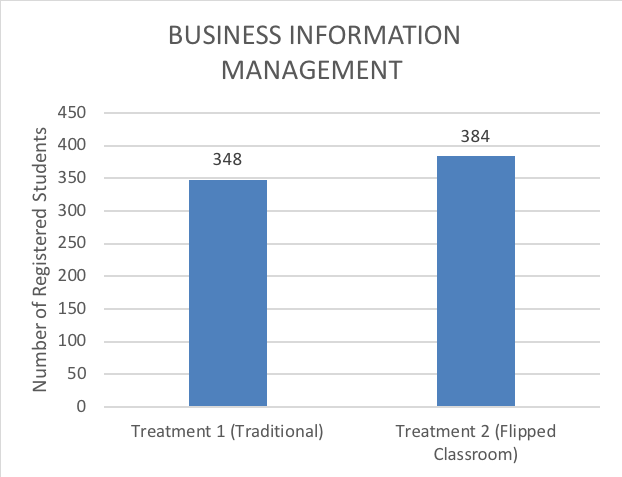
While the same resources were issued to all students for both years of this study, a different teaching treatment was used. In the traditional teaching environment (referred to as Treatment 1 in the tables), students attended a lecture the week before they attended the lab and the supplementary videos covered material that related to the lecture material. The following year, a flipped classroom approach was used, whereby students only had access to the videos and no lecture was provided before the lab (referred to as Treatment 2 in the tables). Figure 1 provides data on the number of students taking the module each year.
The Video Tutorials
The videos covered five topics and demonstrated how certain tasks were implemented using Microsoft Excel. The videos were recorded using CamStudio and included an audio commentary. At the time of recording, the maximum length of video that could be uploaded to YouTube was 15 minutes. Therefore, longer videos had to be segmented to meet this technical constraint. In total, there were 17 videos with 13,355 views over the two-year period. It should be noted that a ‘view’ is similar to a ‘hit’ for a website; once a video is accessed, for whatever length of time, it is counted as a view. Comprehensive video details are provided in Table 1.
The videos were intentionally unlisted on YouTube with links provided only through the university virtual learning environment (VLE) to ensure only course participants accessed the videos. The number of hits verified that views were only logged while the courses were running. As outlined in Table 1, each weekly topic comprised between two and four videos. To view each video, students had to purposefully click on a new link.
Data Collection and Analysis
Data on video usage is collected automatically by YouTube and made available to YouTube channel owners. It is possible to generate specific reports in YouTube within defined time periods; given the module ran on a weekly basis, report data were summarised weekly. The data fields available for each week included:
-
Number of views
-
Estimated number of minutes watched
-
Average view duration (in minutes)
-
Average percentage viewed
-
Unique views (Web only)
The weekly reports were downloaded, and the data fields were then summarised for each video based on three time periods:
-
Lab-related period: As links to the videos were made available in the week prior to the practical laboratory classes, data was included for both weeks.
-
Exam-related period: As we were also interested in the use of videos as a revision aid, we included the week the exams took place as well as the week preceding the exam.
-
Interval-related period: this data summarised the period between the lab period and the exam period.
The data for each of these time periods, for each separate video, and each separate teaching treatment, were then collated in one data file and used for the analysis presented in the next section.
Results and Discussion
As outlined in Table 1, five weekly topics comprising 17 videos were made available to students.
|
Weekly Video Topic |
Series of Videos in Each Topic |
Video Topic Number |
Video Length (min:sec) |
Sum of Unique Views* |
||
|---|---|---|---|---|---|---|
|
Treatment 1 (Traditional) |
Treatment 2 (Flipped Classroom) |
Total |
||||
|
Topic 1: Data Filtering and Totalling (Easy) |
Data Filtering |
1 |
14:10 |
504 |
409 |
913 |
|
Data Sorting |
2 |
13:27 |
607 |
450 |
1057 |
|
|
Data Outlining & Subtotaling (Part 1) |
3 |
10:14 |
511 |
409 |
920 |
|
|
Data Outlining & Subtotaling (Part 2) |
4 |
5:26 |
457 |
360 |
817 |
|
|
Topic 2: Data Reporting and Visualisation (Easy) |
Pivot Tables |
1 |
10:58 |
519 |
445 |
964 |
|
Conditional Formatting |
2 |
12:50 |
454 |
401 |
855 |
|
|
Topic 3: Logical Statements (Difficult) |
AND/OR |
1 |
14:49 |
459 |
354 |
813 |
|
IF |
2 |
6:15 |
522 |
334 |
856 |
|
|
Nested Statements (Part 1) |
3 |
8:37 |
438 |
329 |
767 |
|
|
Nested Statements (Part 2) |
4 |
8:35 |
388 |
296 |
684 |
|
|
Topic 4: Cashflow Statements for Businesses (Easy) |
Cashflow (Part 1) |
1 |
12:40 |
411 |
370 |
781 |
|
Cashflow (Part 2) |
2 |
15:00 |
350 |
310 |
660 |
|
|
Cashflow-Goalseek |
3 |
8:14 |
340 |
280 |
620 |
|
|
Cashflow- Scenarios |
4 |
7:53 |
317 |
268 |
585 |
|
|
Topic 5: Linear Programming (Difficult) |
Solver (Part 1) |
1 |
7:53 |
416 |
317 |
733 |
|
Solver (Part 2) |
2 |
14:27 |
397 |
289 |
686 |
|
|
Solver (Part 3) |
3 |
8:49 |
370 |
274 |
644 |
|
|
Total |
|
17 |
|
7,460 |
5,895 |
13,355 |
The remainder of this section discusses the findings for each of the above presented questions:
-
Research Question 1: Do students view videos more when used in a flipped classroom or when they are a supplementary resource to a traditional lecture?
We expected that in Treatment 2 (flipped classroom without a traditional lecture), there would be more student views of videos as these were the primary resource available to students.
Examining only the total number of views would suggest that the flipped classroom approach was not as effective in getting students to engage with the video material (5895 total views in Treatment 2 [384 students]vs. 7460 total views in Treatment 1 [348 students])(see Table 1).
-
Research Question 2: To what extent do students use videos as a tool for (a) initial learning (b) revision?
While the total number of views suggests that treatment 1 was more effective than treatment 2 in terms of total number of views, we then examined the number of unique views per student to account for different class sizes (N=348 and 384 respectively) (Figure 1). When a traditional lecture was provided on the topic (treatment 1), there were more unique views per student (21.44) than in the flipped classroom (15.31) (treatment 2).
When examining views per student by time period the videos were used more as a revision aid prior to the exam when a lecture had been given (11.84), as opposed to when the class was flipped (8.72) (see Table 2). Students tended to access the videos more during the exam period than during the lab period, for both treatments, and there more unique views in treatment 1 for both time periods. These access patterns during the exam period are in accordance with findings by (M. et al., 2013) and (J.A. et al., 2004), who found that access rates increased significantly around exam time.
|
Unique views per student |
Treatment 1 Traditional |
Treatment 2 Flipped |
|---|---|---|
|
For the semester |
21.44 |
15.31 |
|
In the Lab period |
6.35 (31%) |
5.81 (38%) |
|
In the Exam period |
11.84 (55%) |
8.72 (57%) |
It should be noted that, given the available data, it was not possible to relate individual students to specific views. Therefore, it was possible that some students viewed videos during the lab period and during the exam period, while others did not view any videos. It was not possible to identify the degree to which this occurred.
-
Research Question 3: Does the difficulty of the material affect video viewing patterns?
As the number of students in each treatment, and the number of videos per topic varied, the average views per student per video (Table 3) was used to provide comparable figures. Two topics, logical operators (topic 3) and linear programming (topic 5), were identified as difficult both by the researchers and teaching colleagues.
|
Lab Period |
Interval Period |
Exam Period |
||||
|---|---|---|---|---|---|---|
|
Treatment 1 |
Treatment 2 |
Treatment 1 |
Treatment 2 |
Treatment 1 |
Treatment 2 |
|
|
Topic 1: Data Filtering and Totalling (Easy) |
0.34 |
0.41 |
0.44 |
0.04 |
0.71 |
0.60 |
|
Topic 2: Data Reporting and Visualisation (Easy) |
0.32 |
0.32 |
0.36 |
0.16 |
0.72 |
0.62 |
|
Topic 3: Logical Statements (Difficult) |
0.47 |
0.28 |
0.20 |
0.02 |
0.63 |
0.51 |
|
Topic 4: Cashflow Statements for Businesses (Easy) |
0.20 |
0.35 |
0.00 |
0.00 |
0.82 |
0.45 |
|
Topic 5: Linear Programming (Difficult) |
0.55 |
0.36 |
0.00 |
0.00 |
0.59 |
0.41 |
When students were given a lecture on the topic (Treatment 1), the more difficult topics (topics 3 & 5) were viewed most during the lab period (0.47 and 0.55) while the easiest topics (topics 1, 2, and 4) were viewed least. One possible explanation could be that the lecture alerted students to the relative difficulty of material; consequently, students were more likely to watch videos on topics that they knew to be difficult, during the lab period. In the flipped year (Treatment 2), however, students were not aware of the difficulty of the various topics in advance. While the first topic was viewed most during the lab period (0.41), and one of the difficult topics (topic 3) was viewed least (0.28), there was no other discernible pattern.
In treatment 1, when it came to the use of videos during the exam period, students viewed the more difficult topics (0.63 and 0.59) least. In the same exam period for treatment 2, students tended to watch the earlier videos more than the later videos, suggesting that perhaps students lost interest or needed a supplementary lecture to instil in them the importance of the content and topic difficulty.
-
Research Question 4: How much [what proportion] of the videos are watched?
The number of minutes each video was watched was also examined. This was useful as such data has not been explored in related studies in this field. Studies that rely on the number of views as a measure of engagement have limited value as an additional view is counted regardless of whether one second or the entire video was subsequently watched. By analysing the number of minutes watched, we can also determine the extent of the viewing. Table 4 Table 4 presents the number of minutes watched per topic, for both treatments.
|
Topic |
Treatment 1 (Traditional) |
Treatment 2 (Flipped Classroom) |
|---|---|---|
|
Topic 1: Data Filtering and Totalling (Easy) |
17,403 |
14,265 |
|
Topic 2: Data Reporting and Visualisation (Easy) |
8,661 |
7,705 |
|
Topic 3: Logical Statements (Difficult) |
12,224 |
9,516 |
|
Topic 4: Cashflow Statements for Businesses (Easy) |
10,827 |
9,889 |
|
Topic 5: Linear Programming (Difficult) |
8,777 |
7,124 |
|
Total |
57,892 |
48,499 |
To make the figures comparable given different class sizes, Table 5 shows the average minutes watched per student.
|
Topic |
Treatment 1 |
Treatment 2 |
|---|---|---|
|
Topic 1: Data Filtering and Totalling (Easy) |
50.01 |
37.15 |
|
Topic 2: Data Reporting and Visualisation (Easy) |
24.89 |
20.07 |
|
Topic 3: Logical Statements (Difficult) |
35.13 |
24.78 |
|
Topic 4: Cashflow Statements for Businesses (Easy) |
31.11 |
25.75 |
|
Topic 5: Linear Programming (Difficult) |
25.22 |
18.55 |
Not only were there more unique views for every topic in Treatment 1 compared to Treatment 2 (Table 1), the average number of minutes watched per student was higher in Treatment 1 than Treatment 2 for each topic (Table 5). While it was possible that videos could be accessed and allowed to play to the end, without actually reviewing the content, this possibility was equally present in both treatments.
Delving deeper, the average number of minutes watched per student per time period was also examined. Table 6 shows that, for Treatment 1, the average number of minutes viewed during the exam period (column 4) was greater than during the lab period (column 2), for all 5 topics. This pattern was also evident for Treatment 2, (columns 5 and 3 respectively) for all but topic 5.
|
Lab Period |
Interval Period |
Exam Period |
||||
|---|---|---|---|---|---|---|
|
Topic |
Treatment 1 |
Treatment 2 |
Treatment 1 |
Treatment 2 |
Treatment 1 |
Treatment 2 |
|
Topic 1: Data Filtering and Totaling (Easy) |
9.95 |
14.63 |
14.92 |
1.57 |
25.14 |
20.96 |
|
Topic 2: Data Reporting and Visualisation (Easy) |
5.17 |
5.74 |
6.45 |
2.88 |
13.27 |
11.45 |
|
Topic 3: Logical Statements (Difficult) |
12.49 |
8.64 |
6.21 |
1.59 |
16.43 |
14.56 |
|
Topic 4: Cashflow Statements for Businesses (Easy) |
6.31 |
12.17 |
0.00 |
0.00 |
24.80 |
13.58 |
|
Topic 5: Linear Programming (Difficult) |
12.41 |
10.10 |
0.00 |
0.00 |
12.81 |
8.45 |
The relatively short length of the videos is possibly a contributing factor in the viewing rates, which agrees with the findings in (J. et al., 2014) (K. et al., 2018; Y. et al., 2018) who mentioned that students tend to become demotivated with and abandon long videos.
-
Research Question 5: Does the difficulty of the material affect how much [what proportion] of the videos are watched?
In Table 6 it can be seen that during the lab period for treatment 1, where there was a lecture prior to labs, the more difficult topics (topics 3 and 5) were watched for longer (12.49 and 12.41 minutes on average) than the easier topics (topic 1, 2, and 4) (9.95, 5.17, and 6.31 minutes on average, respectively). One reason for this may be that the advance lecture alerted students to the relative ease or difficulty of the topic.
Furthermore, despite receiving a lecture on the topic, students in treatment 1 watched the more difficult videos for a longer period (12.49 and 12.41) than the Treatment 2 students (8.64 and 10.10 minutes on average). For some students it seems the videos were used to reinforce the lecture content but, in treatment 2 when no lecture was provided, students were less likely to view the available videos.
During the exam period the more difficult topics (3 and 5) were watched for longer when there was also a lecture (16.43 and 12.81 minutes on average) compared to the same videos under treatment 2 (14.56 and 8.45). This again suggests that the lecture in treatment 1 alerted students to more difficult topics. Interestingly, students in treatment 2 watched easy videos 1, 2, and 4 for longer during the exam period (20.96, 11.45, and 13.58) than during the lab period (14.63, 5.74, and 12.17 minutes on average), possibly because this was their only source of instructional content in the period leading up to the exam.
Another way of analysing the data was to look at the proportion of minutes viewed in the lab period compared to the exam period. Table 7 illustrates a number of interesting trends. The proportion of minutes watched overall indicate that when there were lectures (treatment 1), the videos were used primarily as a revision aid (overall 56.17% of the minutes viewed were during the exam period, for treatment 1).
In treatment 2, it would have been reasonable to expect that more minutes would be viewed during the lab period, as no lectures were provided; however, the videos were also used more often as a revision aid during the exam period (54.10% of minutes viewed). Nonetheless, proportionately more minutes were viewed during the lab period (40.91%) for treatment 2 than during the lab period for treatment 1 (29.14%).
|
Treatment 1 |
Treatment 2 |
|||||
|---|---|---|---|---|---|---|
|
Topic |
Lab Period |
Interval Period |
Exam Period |
Lab Period |
Interval Period |
Exam Period |
|
Topic 1: Data Filtering and Totalling (Easy) |
19.90% |
28.83% |
50.26% |
39.37% |
4.22% |
56.41% |
|
Topic 2: Data Reporting and Visualisation (Easy) |
20.77% |
25.91% |
53.32% |
28.62% |
14.33% |
57.05% |
|
Topic 3: Logical Statements (Difficult) |
35.57% |
17.67% |
46.76% |
34.85% |
6.40% |
58.75% |
|
Topic 4: Cashflow Statements for Businesses (Easy) |
28.28% |
0.00% |
79.72% |
47.26% |
0.00% |
52.74% |
|
Topic 5: Linear Programming (Difficult) |
49.20% |
0.00% |
50.80% |
54.44% |
0.00% |
45.56% |
|
Overall |
29.14% |
14.68% |
56.17% |
40.91% |
4.99% |
54.10% |
-
Research Question 6: To what extent do students watch a series of videos on a topic?
Given the number of views and the number of minutes watched per video, it was possible to calculate the average minutes watched per view, for the lab, interval and exam time periods (Table 8).
If students were going to ‘give up' on a topic, it is reasonable to assume that they would likely watch the first in a series of videos for a topic and then stop watching the rest of the series; in other words, the proportion of videos watched should decrease over the series.
For treatment 1, we can see that for topic 2 (easy), video 1 was watched for longer than video 2 (63% viewed on average vs. 54%), for both treatments and during the lab and exam periods. However, for all other easy and difficult topics and videos, there is no obvious pattern for either treatment.
|
Series of Videos in Each Topic |
Treatment 1 |
Treatment 2 |
||||
|---|---|---|---|---|---|---|
|
Lab Period |
Interval Period |
Exam Period |
Lab Period |
Interval Period |
Exam Period |
|
|
Topic 1: Data Filtering and Totalling (Easy) |
|
|
|
|
|
|
|
Data Filtering |
55% |
60% |
62% |
58% |
62% |
60% |
|
Data Sorting |
51% |
53% |
60% |
62% |
54% |
59% |
|
Data Outlining & Subtotaling Part 1 |
53% |
63% |
68% |
63% |
63% |
68% |
|
Data Outlining & Subtotaling Part 2 |
47% |
72% |
71% |
60% |
50% |
71% |
|
|
|
|
|
|
|
|
|
Topic 2: Data Reporting and Visualisation (Easy) |
|
|
|
|
|
|
|
Pivot Tables |
63% |
66% |
67% |
67% |
55% |
64% |
|
Conditional Formatting |
54% |
51% |
58% |
62% |
51% |
57% |
|
|
|
|
|
|
|
|
|
Topic 3: Logical Statements (Difficult) |
|
|
|
|
|
|
|
AND/OR |
61% |
61% |
54% |
64% |
43% |
57% |
|
IF |
58% |
63% |
57% |
68% |
44% |
68% |
|
Nested Statements Part 1 |
55% |
66% |
62% |
65% |
48% |
64% |
|
Nested Statements Part 2 |
54% |
67% |
57% |
59% |
31% |
56% |
|
|
|
|
|
|
|
|
|
Topic 4: Cashflow Statements for Businesses (Easy) |
|
|
|
|
|
|
|
Cashflow Part 1 |
56% |
0% |
55% |
70% |
0% |
52% |
|
Cashflow Part 2 |
47% |
0% |
52% |
63% |
0% |
49% |
|
Cashflow-Goalseek |
54% |
0% |
56% |
62% |
0% |
53% |
|
Cashflow- Scenarios |
58% |
0% |
55% |
64% |
0% |
56% |
|
|
|
|
|
|
|
|
|
Topic 5: Linear Programming (Difficult) |
|
|
|
|
|
|
|
Solver Part 1 |
59% |
0% |
56% |
74% |
0% |
53% |
|
Solver Part 2 |
61% |
0% |
51% |
67% |
0% |
50% |
|
Solver Part 3 |
58% |
0% |
59% |
67% |
0% |
59% |
Conclusions, Limitations and Recommendations for Future Work
Conclusions
While we initially assumed that the students would view the videos more in the flipped classroom, when no prior lecture was provided (treatment 2), the opposite is actually the case. Our study found that there were more unique views of videos when a prior lecture was provided (treatment 1), than when no prior lecture was provided (treatment 2). However, when we examined when students used the videos, we found that students used them more as a revision aid prior to the exam, than during the lab period, regardless of whether a lecture was provided (treatment 1) or not (treatment 2). Further studies are required to examine students’ demographic data for the different cohorts (not available to the researchers for this study) and the significance of these observations.
We also examined the data for different video topics, to determine if the difficulty level of the topic affected viewing patterns during the lab and exam periods. We first examined views during the lab period. When students were given a lecture on the topic (Treatment 1), the more difficult topics were viewed more than the easiest topics, suggesting that the lecture was useful as it alerted students to difficult topics. In treatment 2, when no prior lecture was given, while the first (easy) topic was viewed the most during the lab period, there was no other discernible pattern.
During the exam period, students spent the least time watching the difficult videos, for treatment 1. For treatment 2 (no prior lecture), students tended to watch the earlier videos more than the later videos, possibly suggesting fatigue.
When we examined the total number of minutes that were watched for each video topic, we saw that the total number of minutes watched per student was higher in treatment 1. When we analysed the average number of minutes that were watched during the lab and exam periods, for both treatments, we noticed that students spent longer watching each topic during the exam period, than during the lab period (with the exception of the last topic, for treatment 2).
We also observed that, during the lab period for treatment 1 (lectures before labs), the more difficult topics were watched for longer than the easier topics. When compared with the same period for treatment 2, treatment 1 students still watched the difficult videos for longer than the treatment 2 students (possibly because the treatment 2 students did not know they would be difficult).
During the exam period, difficult topics were watched for longer when there was also a lecture (treatment 1), compared to the same period for treatment 2. Students in treatment 2 watched easy videos for longer during the exam period, than during the lab period, possibly because they had not attended a lecture.
When we examined the proportion of minutes watched per time period, we perceived that proportionately, students watched the videos for longer during the exam period than during the lab period, for both treatments.
Finally, when we examined which videos students tended to watch, we noted that for topic 2 (easy), video 1 was watched for longer than video 2, for both treatments and during the lab and exam periods. However, for all other (easy and difficult) topics and videos, there was no obvious pattern for either treatment.
These results have implications for how we might analyse video use moving forward. For example, rather than reviewing the data at the end of a module, it would be worthwhile to monitor video access rates at key points throughout the term, to identify levels of engagement with individual videos and topics. This deeper analysis is also useful to determine the extent of engagement (e.g. length of viewing time) with individual videos, and when students actually view the videos (e.g. during the lab period or during the exam period). It also points to the usefulness of lectures to supplement video resources.
Limitations and Recommendations for Future Work
Because YouTube analytics did not enable us to identify individual students using multiple devices to watch the same video, the study instead focused on the number of unique views, which accounted for multiple views from the same PC (cookies were tracked). Unfortunately, it is not currently possible to calculate the number of multiple views from mobile devices (e.g. smartphones and tablet devices), so students viewing a video multiple times from a mobile device could not be accounted for.
As it was not possible to identify individual students, it is possible that some students viewed videos during the lab period and during the exam period, while others did not view any videos. It was not possible to identify the degree to which this occurred.
While it was possible that a video could be accessed and allowed to play to the end, without actually reviewing the content, this was possible in both years. Finally, we were unable to obtain detailed demographic data relating to students in both years; further studies could investigate student demographics (for different cohorts) and the correlation, if any, with video usage patterns.
For future work, we are interested in conducting further analyses to determine:
-
The number of views at each point in time in the video. For example, are there peak and trough viewing points within each video and can we identify possible reasons for those e.g. are there threshold concepts that may require further exploration in the classroom? This level of analysis would greatly facilitate further refinement of the instructional videos.
-
Who watches the videos through the end - those who tended to watch the videos during the lab weeks or those who tended to watch the videos immediately prior to the exam?
-
Of those who tended to watch the videos immediately prior to the exam, are they viewing the videos for the first time or as a revision aid?